Freshwater withdrawn for irrigation and processing. Not weighted for scarcity.
Water use matters mainly where water is scarce. A litre in a rainy region is not equivalent to a litre in a drought-prone one, so treat this as indicative only.
Poore & Nemecek (2018), OWID version accessed 2026-09-06; life-cycle assessment through retail, per kg retail weight.
Freshwater use weighted by how scarce water is where the food was produced. A litre drawn in a water-stressed region counts for more than a litre in a wet one.
Scarcity weighting depends on where each food is actually grown. Global figures blend many regions; country figures are shown where a source provides them.
Poore & Nemecek (2018), OWID version accessed 2026-09-06; withdrawals weighted by the local Pfister et al. (2009) water-scarcity index, per kg retail weight.
Total iron content. Plant (non-haem) iron is absorbed less efficiently than haem iron from meat, so equal amounts on the label are not equal amounts absorbed.
Roughly 2–20% of non-haem iron from plants is absorbed, against 15–35% of haem iron from meat. Vitamin C with the meal raises plant iron absorption; tea and coffee lower it.
Vitamin B12 content. Unfortified plant foods contain none; fortified products and supplements are the reliable plant-based sources.
Absorption of B12 from food is limited per meal (around 1.5–2 µg), so the amount listed is not the amount absorbed. Fortified foods and supplements provide B12 in a form that is absorbed at least as well as food B12.
Calcium content. Dairy is the best-known source; calcium-set tofu, fortified plant milks and some greens contribute on a plant-based diet.
Around 30% of calcium from milk is absorbed. Calcium-set tofu and fortified soy milk are absorbed similarly; low-oxalate greens (kale, bok choy) better; spinach and beans worse because oxalates and phytates bind it.
Total omega-3 fatty acids. Oily fish provide long-chain EPA and DHA directly; plants provide ALA, which the body converts to EPA and DHA only partially.
Only a small share of plant ALA (typically under 10%) is converted to EPA and less to DHA, so gram-for-gram comparisons overstate what plants deliver. Algal oil supplements provide DHA directly.
Approximate number of animals slaughtered for this amount of food. Small fractions mean one animal yields many portions. Zero for plant foods; dairy and eggs involve animals indirectly.
Dairy and eggs are shown as zero because no animal is slaughtered per unit sold, but both systems involve animals; this metric only counts direct slaughter.
Approximate retail yield per animal inverted; yield assumptions are illustrative, not counts of individual animals spared.
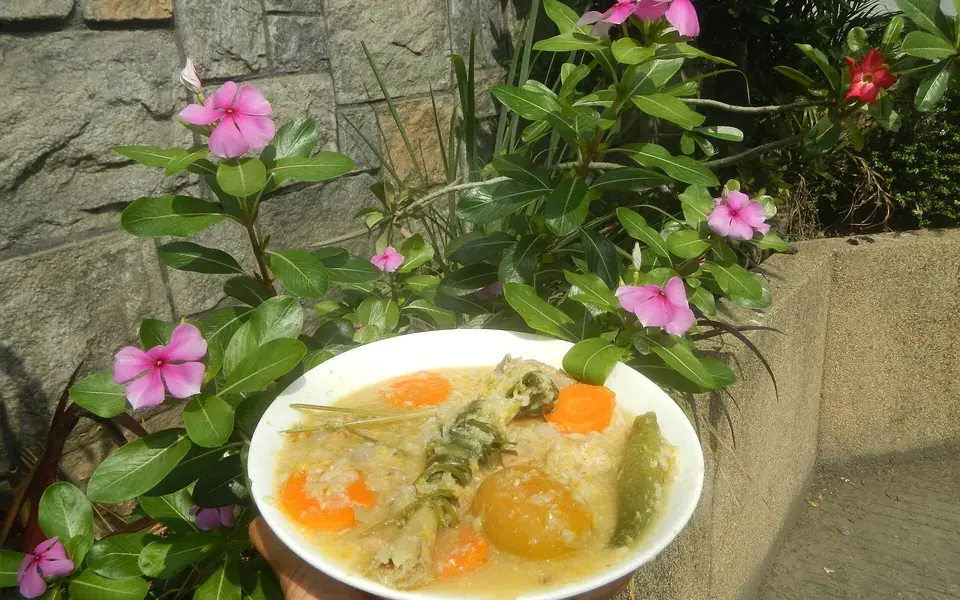
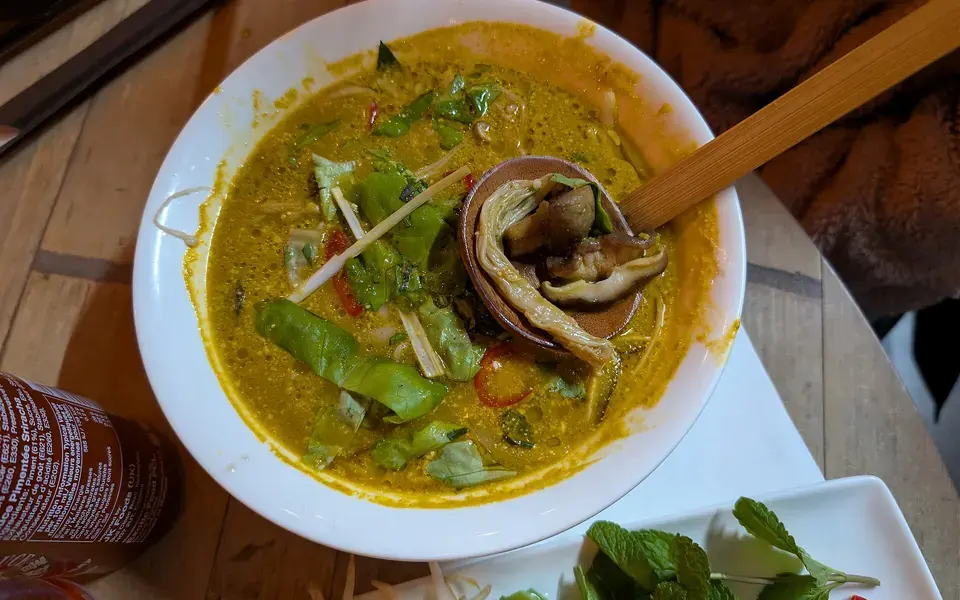
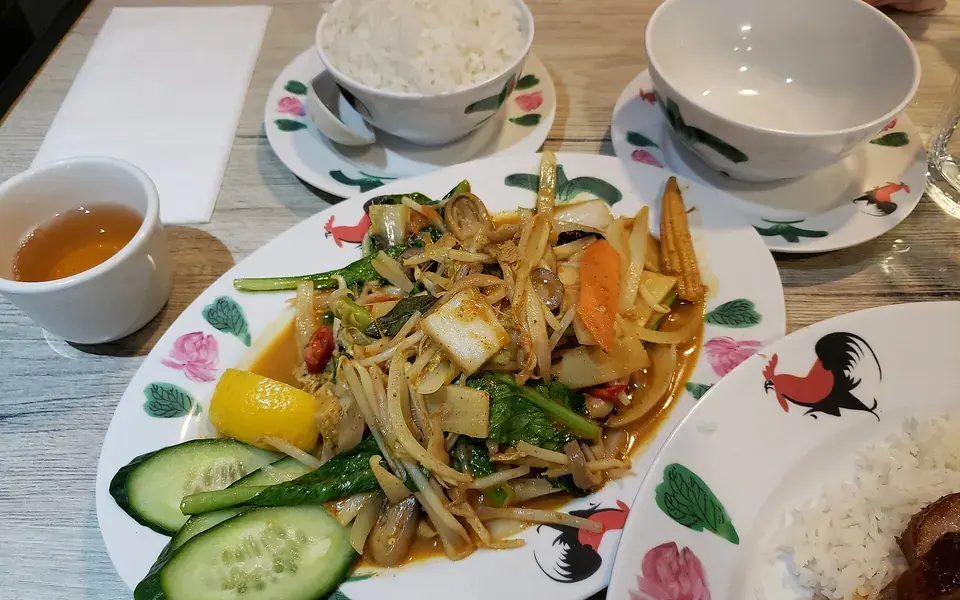
In the dishes below, tofu is used in alternatives to chicken stir-fry, chicken noodle soup, chicken curry. This describes a cooking role; it does not imply identical nutrition.